An e-commerce company manages its flagship application on a load-balanced EC2 instance fleet for web hosting, database API services, and business logic. This tightly coupled architecture makes it inflexible for new feature additions while also making the architecture less scalable.
Which of the following options can be used to decouple the architecture, improve scalability and provide the ability to track the failed orders?
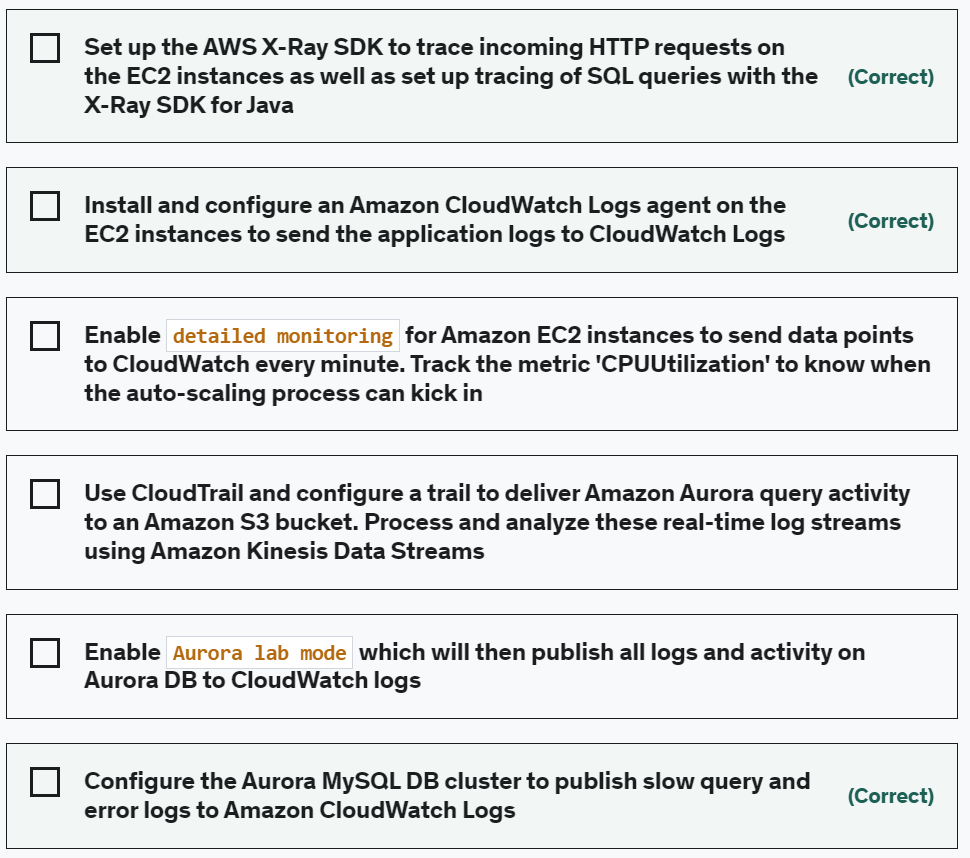
- Set up the AWS X-Ray SDK to trace incoming HTTP requests on the EC2 instances as well as set up tracing of SQL queries with the X-Ray SDK for Java
- Install and configure an Amazon CloudWatch Logs agent on the EC2 instances to send the application logs to CloudWatch Logs
- Configure the Aurora MySQL DB cluster to publish slow query and error logs to Amazon CloudWatch Logs
To make the monitoring process more reliable for troubleshooting future events due to traffic spikes, I would recommend the following steps:
- Implement centralized log management: Set up a centralized log management system that collects logs from all web servers and stores them in a central location. This ensures that even if individual web servers are terminated, their logs are still available for analysis. Tools like ELK Stack (Elasticsearch, Logstash, and Kibana) or Splunk can be used for centralized log management.
- Enable comprehensive application logging: Ensure that the web application is configured to log detailed information about errors and exceptions. This includes logging stack traces, error messages, request/response details, and any relevant contextual information. Having comprehensive logs will help in understanding the root cause of errors during traffic spikes.
- Set up robust database monitoring: Improve the monitoring of the Aurora DB cluster by configuring and collecting relevant metrics. This can include monitoring key performance indicators such as CPU utilization, memory usage, disk I/O, query execution times, and connection pool statistics. Use database monitoring tools or services provided by your cloud provider to gain insights into the performance of the database during high traffic periods.
- Implement real-time monitoring and alerting: Set up real-time monitoring and alerting mechanisms to proactively identify issues during traffic spikes. This can involve using tools like Amazon CloudWatch or third-party monitoring services that allow you to define custom metrics, set thresholds, and receive alerts when certain conditions are met. By monitoring critical metrics in real-time, you can quickly identify and troubleshoot issues as they arise.
- Perform load testing and capacity planning: Conduct load testing exercises to simulate high traffic scenarios and identify any potential bottlenecks or performance issues in the application infrastructure. This will help you understand the system’s capacity limits and enable you to plan for adequate resources during peak traffic periods, such as the Thanksgiving sale. Regularly review and update your capacity planning based on traffic trends and business growth.
By implementing these steps, you can establish a more reliable monitoring process that captures and retains crucial data, enables better troubleshooting, and helps you proactively respond to and mitigate issues during traffic spikes.